"Random" Ordering pattern from Deterministic Demand?
Posted on Sun 16 February 2014 in Core OM and supply chain
While Prof. Sridhar Seshadri and I were co-teaching a PhD course where we were reading John Sterman’s paper on determistic chaos (Sterman, J., 1989. Deterministic Chaos in an Experimental Economic System Journal of Economic Behavior and Organization.), we were discussing the possibility of how determistic customer demands in simple supply chains can result in seemingly “random” ordering processes. I have tried to jot down some thoughts on how it might be possible.
Consider a wholesaler selling to 3 retailers. Suppose that each of these retailers use an economic order quantity rule (EOQ) to decide on their order quantity and frequency. That is, they order
where \(D\) is the annual demand, \(h\) is the annual holding cost, and \(S\) the fixed “setup” costs incurred per order placed. Hence, the number of orders placed per year is \(\frac{D}{Q^{*}}\); and the time between orders is \(\frac{Q^{*}}{D}\) years, which works out to \(\sqrt{\frac{2S}{Dh}}\).
Note that the optimal time between orders ends up being an irrational number. To illustrate how this can result in interesting ordering patterns, suppose that the first retailer has period \(\sqrt{5}\), second one a period \(\sqrt{6}\) and third one a period \(\sqrt{7}\). Since they can only order at integer numbered periods, they choose to place their \(n^{th}\) order at \(\left\lbrack {n\sqrt{5}} \right\rbrack\), \(\left\lbrack {n\sqrt{6}} \right\rbrack\), and \(\left\lbrack {n\sqrt{7}} \right\rbrack\) respectively (where \(\left\lbrack x \right\rbrack\) is the nearest integer to \(x\)). While I dont know whether this is the optimal solution, it appears that this should be close to optimal.
Suppose that in the above setup, the demand \(D\) is \(1\) unit per period. Then, the size of the \(n^{th}\) order is given by \(\left\lbrack {\left( {n + 1} \right)\sqrt{5}} \right\rbrack - \left\lbrack {n\sqrt{5}} \right\rbrack\), \(\left\lbrack {\left( {n + 1} \right)\sqrt{6}} \right\rbrack - \left\lbrack {n\sqrt{6}} \right\rbrack\), and \(\left\lbrack {\left( {n + 1} \right)\sqrt{7}} \right\rbrack - \left\lbrack {n\sqrt{7}} \right\rbrack\) respectively (i.e., enough inventory to last till the next order period). With the above rule, which only involves a small modification of EOQ to account for the fact that orders can be placed only in integer periods, the plot of total ordered received by the single wholesaler is given below.
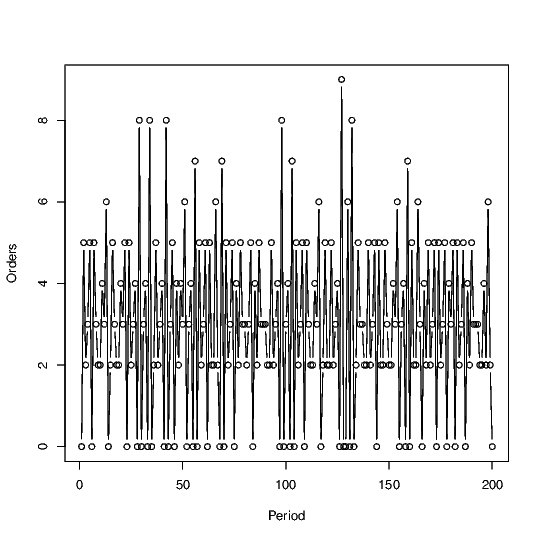
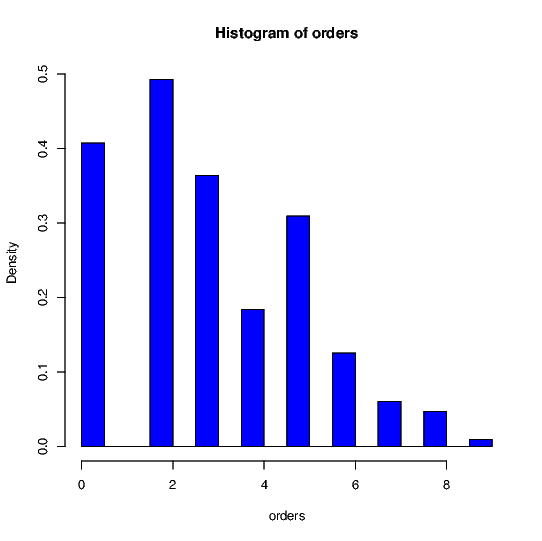
The total order quantity received by the wholesaler in a given period appears quite chaotic (?) and seemingly random. For instance, the histogram of orders as shown below
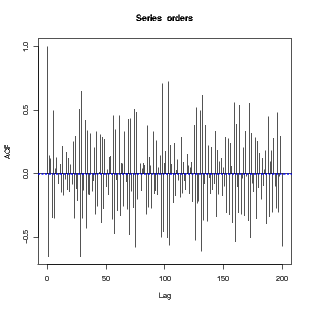
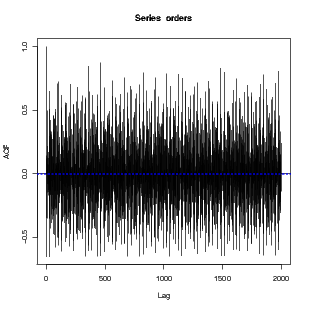
The autocorrelation function for the order quantities are given below.